A new chapter
Last year, I launched Dat⋂Engineer as a place where I share my thoughts, experiences, and lessons learned as a data engineer. From designing to coding, I have written about the craft of data engineering with passion.
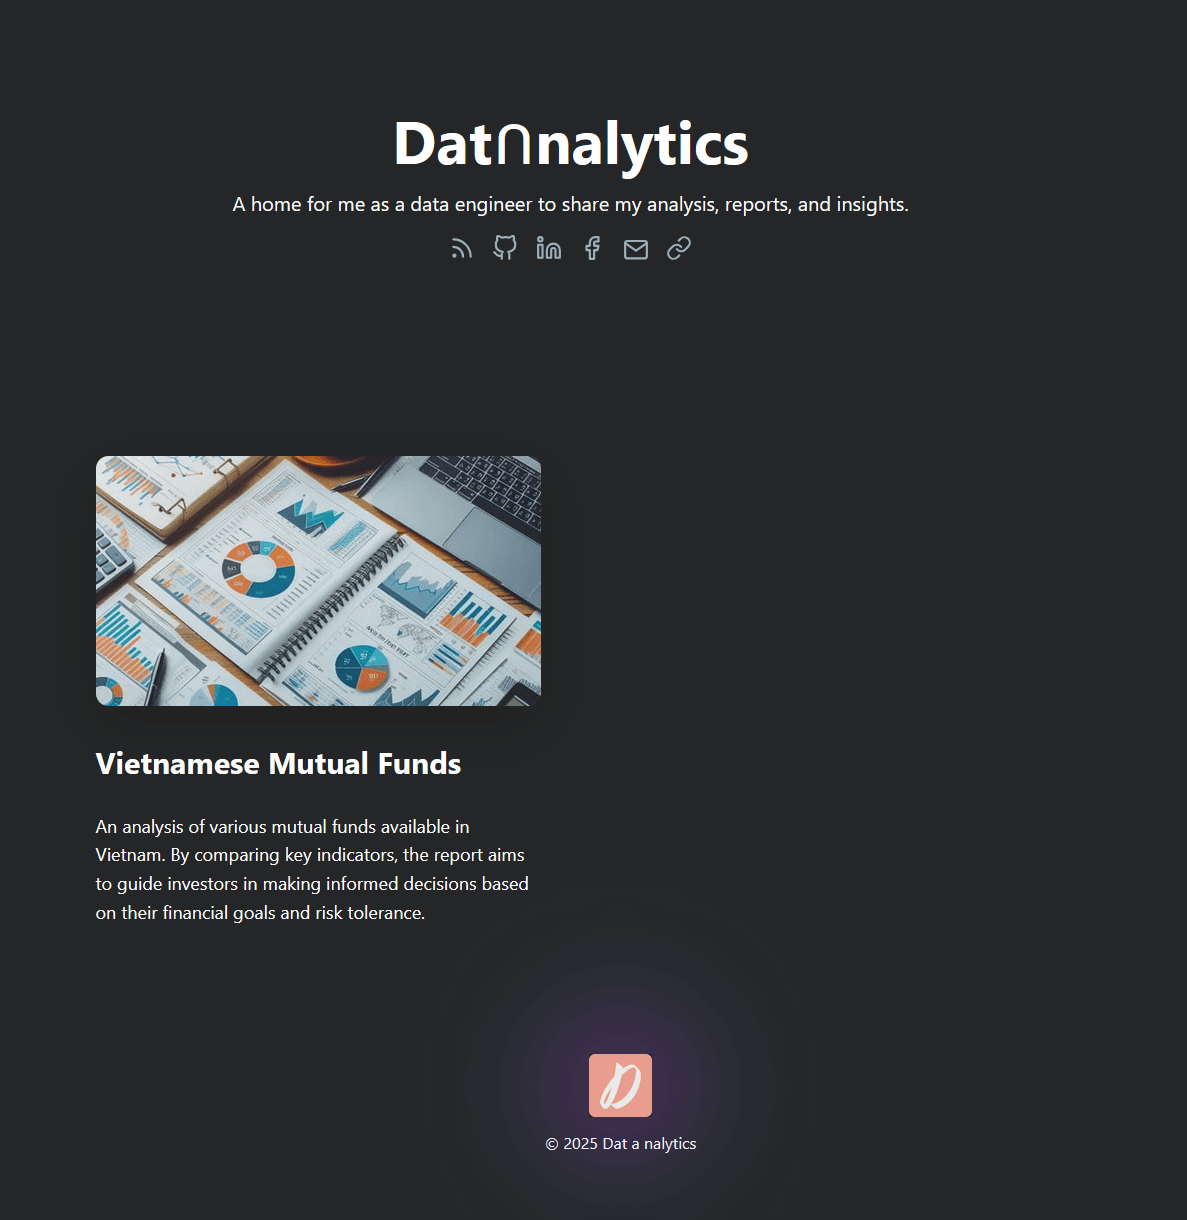
This year, I wanted to go beyond words. I wanted to showcase data - to let data and visualizations tell their own stories. That is why I created Dat⋂nalytics, a new site for sharing interactive Power BI reports and data-driven insights.
The Motivation
After years of working as an engineer, I built a personal IT infrastructure (websites, emails, networks,…) to experiment, learn, and benefit. I maintain my own “small” data system. Because I am the developer, the user, and the investor at the same time, I have to keep it small and efficient. My “small” data system help me answer my own questions. I strongly believe that decisions should be backed by data, whether as an individual or an organization.
This year, during the Tet holiday in Vietnam, I had the opportunity to reconnect with friends. In one of our discussions, I showed him one of my reports. My friend was genuinely excited about it and asked me to share it with him. So that he can use the report for his own decision. At that moment, I realized that my data could benefit others, not just myself.
That is the story led to the creation of Dat⋂nalytics - a place where I could openly share interactive reports, making data more accessible and engaging for everyone.
Development
I am neither a designer nor a web developer. The last time I wrote some basic HTML and CSS was over ten years ago, so creating a stunning, visually rich website was beyond my capabilities. However, I still wanted a functional and elegant way to share my reports.
I decided to use Hugo, a fast and flexible static site generator. With my basic knowledge of HTML and CSS, I was still able to manage and customize it to fit my needs. I used the Quint theme as inspiration. However, Quint is not ready for my need, so I have to tweak a lot.
My reports will be hosted on Power BI, and I will embed them directly on my site. Users can still have a seamless and interactive experience as they are watching reports directly on Power BI service.
The result? A clean, lightweight site that seamlessly integrates Power BI reports while keeping performance in check.

Join me
I am excited to share this next step in my journey with you. Currently, there is only 1 report. And there will be absolutely more reports coming. Check out Dat⋂nalytics. If you have feedbacks, ideas, and feature requests, don’t hesitate to contact me. They will help shape this site into something even better.